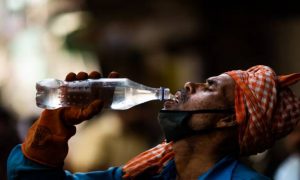
The rapid spike in Covid numbers coupled with reports of vaccine shortages could make things worse, especially for the poorer sections of the Indian economy
Dear Readers,
The last financial year (2020-21) started with the whole country being under one of the strictest (and, grossly ill-planned) lockdowns anywhere in the world. But at that time few would have thought that April 2021 would be worse in terms of Covid cases than April 2020. Indeed, initial government estimates last year suggested that there won’t be any new Covid cases after 16th May 2020.
However, as the chart below shows, Covid cases have registered a “V-shaped” recovery (Source: Covid19India.org). At the last count, India had 1.75 times more daily cases now than the past peak, which was in September 2020.
What’s worse is that this new surge is taking place despite a year of awareness about the crying need to follow Covid-appropriate behaviour as well as the availability of multiple Covid vaccines. Mismanagement of the vaccination drive by the government — with numerous places declaring shortages— as well a wilful disregard for maintaining social distancing norms by the people leaves no one without blame for the current spike.
What does this mean for the Indian economy and its recovery?
Without the latest surge, the first half of the current financial year — that is, from April to September — was expected to register a “V-shaped” recovery. But, of course, this V-shaped recovery is quite different from the V-shaped spike in Covid cases.
Why? Because the recovery in economic growth in the first half of the current financial year will be an optical one. In other words, because the GDP contracted by as much as 15% in the first half of the last financial year, the low base effect will ensure that the GDP growth rate looks very handsome in the first half of the current financial year.
But, in terms of the absolute level of GDP (not its growth rate), India would not be adding as much. Look at the chart below (courtesy: Crisil) to understand it more clearly.
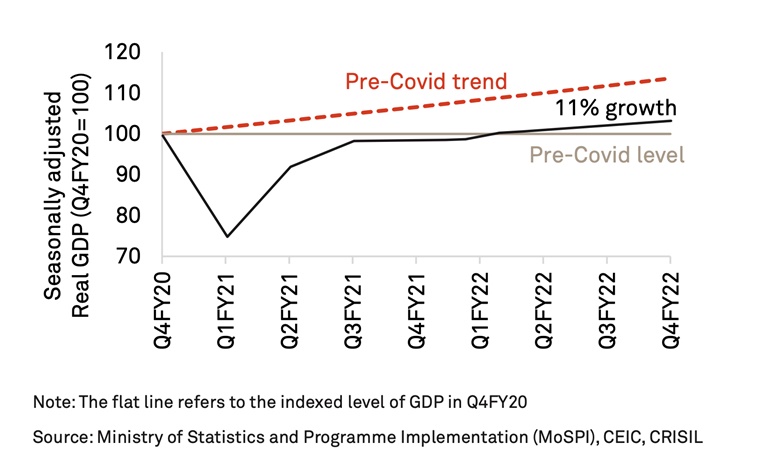
According to Crisil, by the end of 2021-22, GDP will only be approximately 2% higher than March 2020 level. More importantly, the absolute GDP would be roughly 10% below its pre-pandemic trend level.
Do note the consistent gap between the pre-Covid trend (red line) and the new trend (black line). This gap represents the permanent loss of 11% of GDP in real terms over the fiscal years 2021-22 through to 2024-25 that the Indian economy will suffer even after the expected recovery.
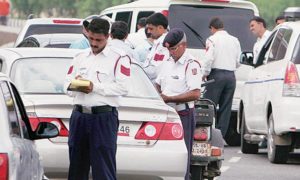
Of course, this chart is from an analysis in late March and since then Covid cases have rapidly gone up even as vaccination efforts have been hampered by shortages. As such, the news could get worse. A case in point is the second wave of reverse migration of labourers.
Moreover, the latest surge threatens not just the overall income levels but also its distribution.
The past year saw a massive spike in income and wealth inequalities. While millions are expected to be pushed below the poverty line, the fortunes of the biggest companies and the richest Indians have soared. The latest Forbes annual list of billionaires found that India has the world’s third-highest number of billionaires with Mukesh Ambani dethroning Jack Ma to become the richest man in Asia. In fact, the three richest Indians alone added over $100 billion (around Rs 7.4 trillion) between them over the past year.
But compare that to the existing inequalities in India and how the Covid pandemic is likely to exacerbate them.
Look at this chart below prepared by Max Roser of Our World in Data. It maps the percentage of population in each country that lives on less than $30 a day (roughly an income of Rs 66,000 per month). In India, 99.5% of all population lives below this number. If you earn more than that amount, you are in the top 0.5% of this country in terms of daily income.
What is equally bad about this chart is the width of the India band, which shows the absolute number of people there are in the country. Even in China, whose GDP is almost five times India’s, the share of the population living below this mark is 94%. In a developed country like the US, this figure is just 22%.
The point is, India already has wide inequalities and Covid-induced disruption is just making them wider.
Typically, at this point, one would ask what the government is doing to alleviate the economic stress.
The latest data (see the bar graph below) from the International Monetary Fund World Economic Outlook further shows how governments of some of the richer countries like the US have supported the livelihoods of their population far more than India.
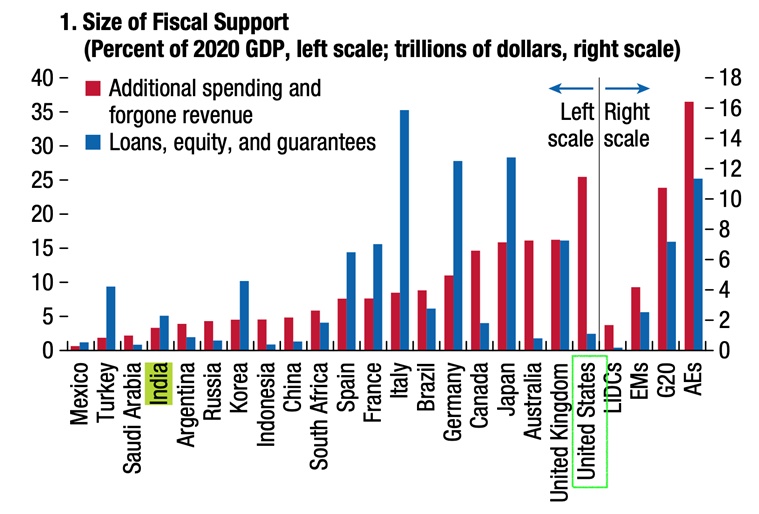
It is important to note the height of the red bars, which represent either additional spending by the government or revenue foregone via tax relief. In many western countries such as the US and UK, additional funding has gone to the middle class and below cohort while the rich are being targeted with higher taxes to part-fund this expenditure.
In India, not only is the direct fiscal expenditure much smaller but also the middle class and below cohort is also the one which is worst affected by rising inflation and poor purchasing power, thanks to high indirect taxes such as on fuel.
Of course, no government in a much poorer economy like India can afford to support its population the way the US has done — the latest Covid relief package by the Biden administration was $1.9 trillion, which is roughly 70% of India’s annual GDP.
But, it is significant that in contrast to the US or UK, the Indian government’s approach has been to incentivise the private sector to invest more via continued tax breaks such as the corporate tax cuts that were announced in 2019.
The question is will this strategy work? Will the private sector invest and pull the Indian economy out of its current crisis, especially in the second half of the year when the optical growth has vaned?
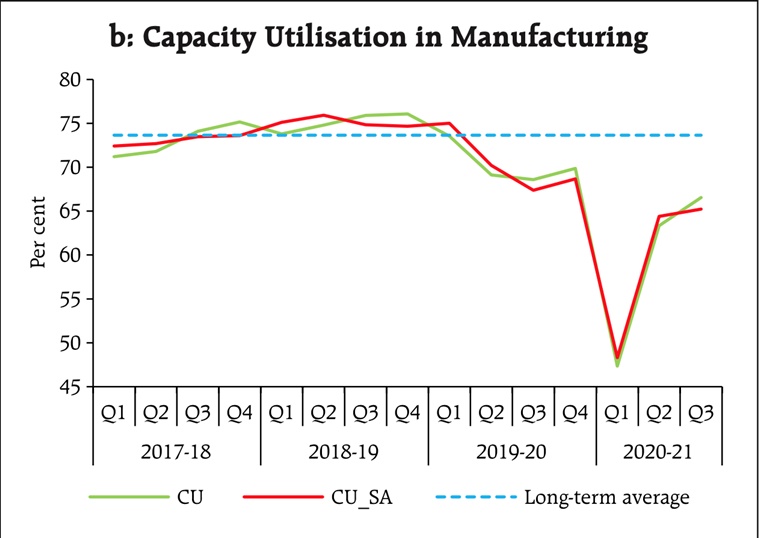
The latest data from the RBI’s surveys suggests that this may not be the case in a hurry.
Typically, firms invest when they are already exhausting their current production capacities and believe that investing in new productive capacities will bring in more profits.
The chart below shows the latest available capacity utilisation levels in the manufacturing sector. Whether it is seasonally adjusted (SA) or not, Capacity Utilisation (CU) is far below its long-term average.
Another chart below from the 52nd round of the Order Books, Inventories and Capacity Utilisation Survey (OBICUS) of the RBI — given below — shows how the ratio of raw material inventory (RMI) to sales — shown by the red line — had started trending up in the third quarter (October to December 2020) of the last financial year. In other words, the inventories were piling up even in a quarter when India was coming out of a technical recession.

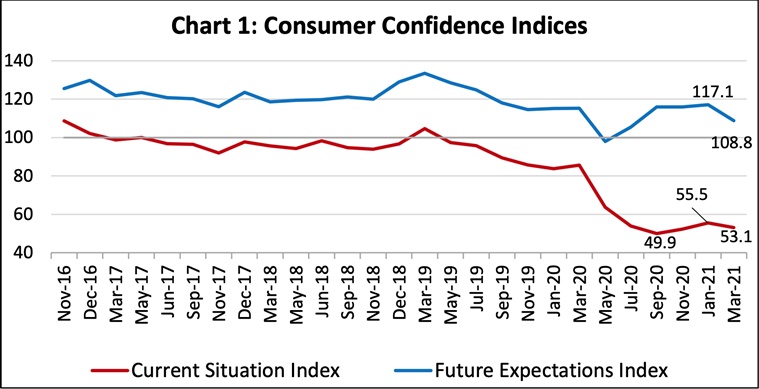
Not surprisingly, when the RBI surveyed consumers across several Indian cities, it found that the confidence level has started to fall again — see the chart below
This is not to suggest that all is gloom and doom for the Indian economy. Indeed, with sustained policy support as shown in the latest credit policy review by the RBI and a faster rollout of vaccines, India can dodge the possibility of 2021 becoming a repeat of 2020.
Wear a mask — stay safe and keep everyone around you safe as well.