
Sameet Chavan of Angel One says Traders should trade with a positive bias as long as the index remains above 17,000–16,800
The market wound up the last week of 2021 on a high amid low volumes and also had a strong start to the January series on December 31.
The Nifty climbed above 17,300 to close at its highest level since December 13, up 2 percent in the week ended December 31, forming a bullish candle on the weekly as well as the daily charts.
The rally was broad-based and the index concluded the year with 24 percent gains. Experts expect the rally to continue in the coming days and the Nifty at 17,400-17,500. If the index stabilises around these levels, a sharp rally can’t be ruled out.
“As a conservative trader, one can wait for a sustainable close above 17,400, which is the higher end of the ‘Downward Sloping Channel’ on the daily chart. But the way individual stocks are behaving, it is likely to happen in the coming session only,” said Sameet Chavan, Chief Analyst-Technical and Derivatives at Angel One. After this, the immediate levels to watch out for would be 17,550–17,700, he said.
On the flip side, the base shifted to 17,000–16,800 before which 17,150 was considered the key support.
Traders should trade with a positive bias as long as the index remains above the mentioned base.
Here are experts’ top 12 trading ideas for the January series. Returns are based on the December 31 closing prices:
Expert | Nandish Shah, Senior Technical & Derivative Analyst, HDFC Securities
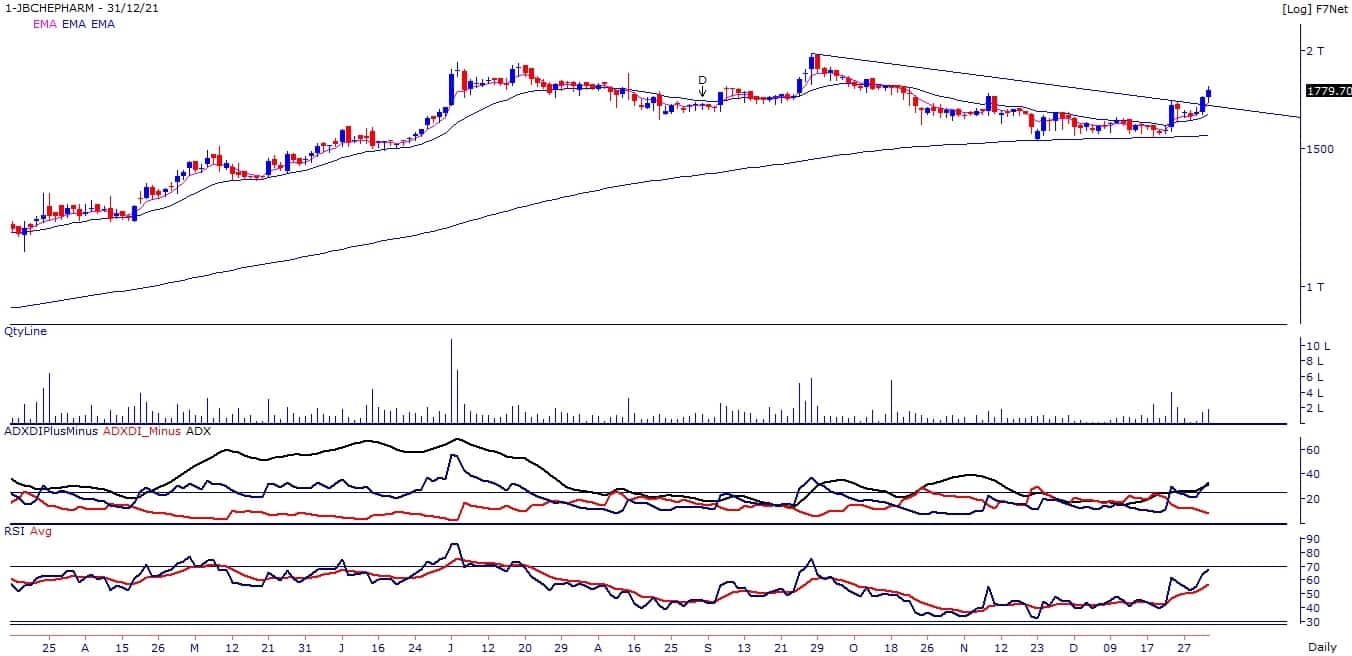
JB Chemicals and Pharmaceuticals: Buy | LTP: Rs 1,779.70 | Stoploss: Rs 1,670 | Target: Rs 1,960 | Return: 10 percent
The stock price has broken out from the downward sloping trendline on the daily chart. The short-term trend is positive as the stock is trading above its 5 and 20-day exponential moving average (EMA).
The relative strength index (RSI) and money flow index (MFI) oscillators are placed above 60 and rising upwards, indicating strength in the uptrend.
Plus directional indicator (DI) is trading above -DI, while average directional index (ADX) line is placed above 25, yet another indicator of momentum in the uptrend.
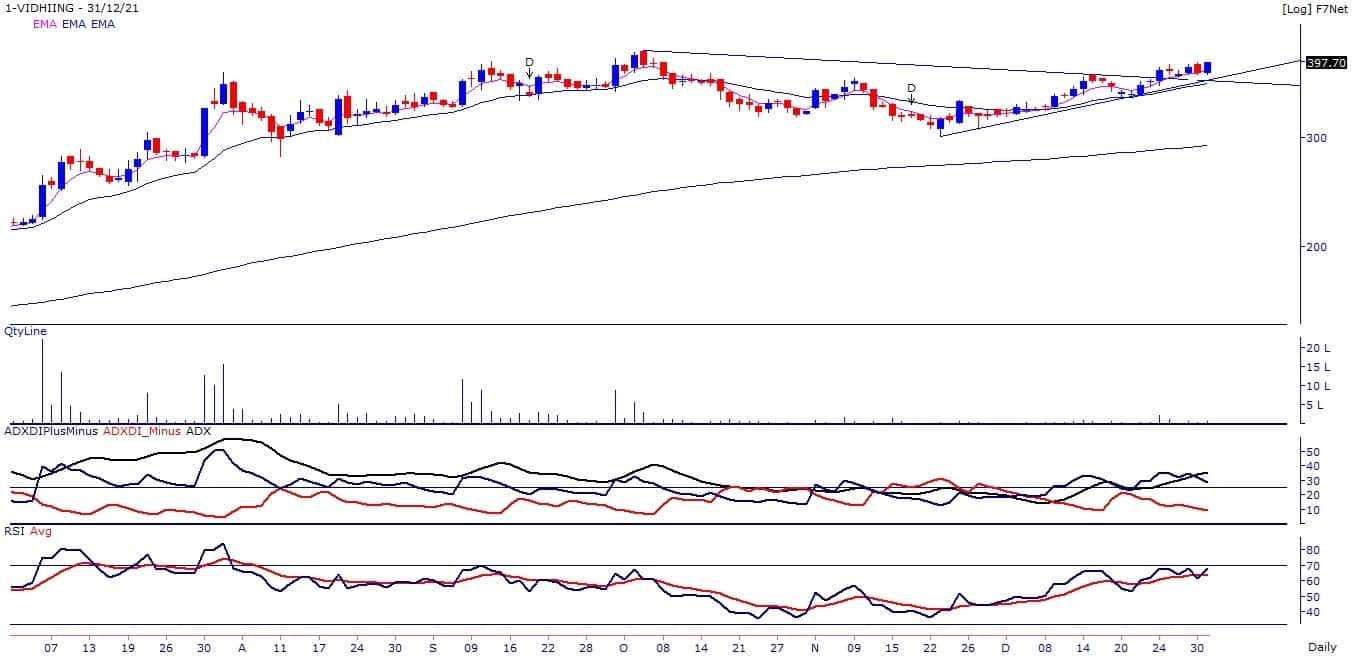
Vidhi Specialty Food Ingredients: Buy | LTP: Rs 395.35 | Stop-Loss: Rs 375 | Target: Rs 440 | Return: 11 percent
The stock price has broken out from the symmetrical triangle on the daily chart. The short-term trend remains strong as it is trading above all its important short-term moving averages.
RSI and MFI oscillator are placed above 60 and rising upwards, indicating strength in the current uptrend. Plus DI is trading above -DI ,while ADX line is placed above 25, indicating momentum in the current uptrend.
Expert: Ruchit Jain, Lead Research at 5paisa.com
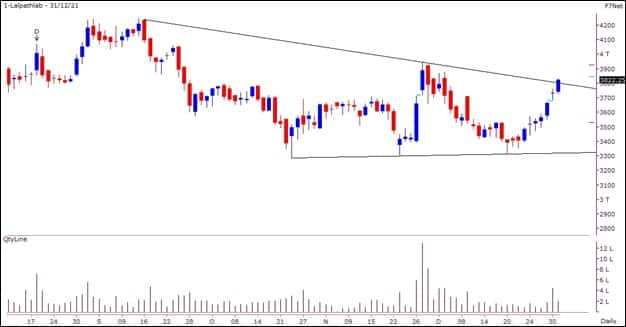
Dr Lal PathLabs: Buy | LTP: Rs 3,822.25 | Stop-Loss: Rs 3,670 | Target: Rs 4,060 | Return: 6.2 percent
The stock has been consolidating within a broad range for the last three months. During this consolidation, prices formed a support base around Rs 3,300 and have seen buying interest there.
On daily charts, the stock has given a breakout above a falling trendline resistance of the consolidation and this should lead to buying interest in the stock in the short term.
In the last month if we analyse the volume action along with price moves, volumes were good on price up move and low during correction, which is a positive sign.
Hence, traders can look to trade with a positive bias and buy in the range of Rs 3,820-3,800 for a potential target of Rs 4,060. One can place a stop-loss below Rs 3,670 on long positions.
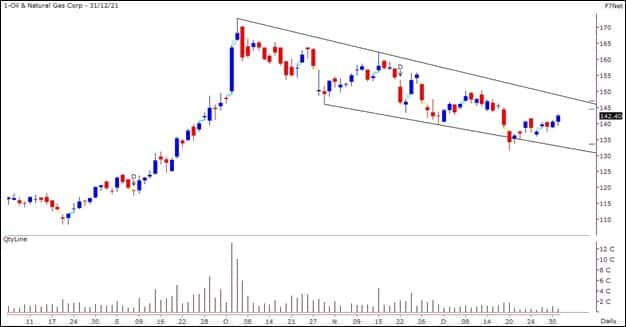
ONGC: Buy | LTP: Rs 142.40 | Stop-Loss: Rs 136 | Target: Rs 152 | Return: 6.74 percent
After an impulsive up move till October, prices entered a corrective phase within an uptrend and have been trading in a channel. While the volumes were good during price upmove, the corrections were not backed by higher volumes which is a positive sign.
From the support end of the channel, the stock has witnessed some buying interest and prices have given a breakout above its swing high on the lower time frame chart.
We expect the stock to rally towards the higher end of the channel in the near term. In the long-term charts, we anticipate a breakout in this leg of up move.
Hence, traders can look to trade with a positive bias and buy in the range of Rs 142-140 for potential targets of Rs 149 and 152. One can place a stop-loss below Rs 136 on long positions.
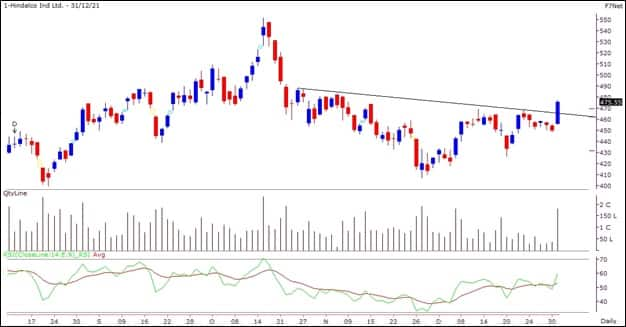
Hindalco Industries: Buy | LTP: Rs 475.55 | Stop-Loss: Rs 455 | Target: Rs 510 | Return: 7.2 percent
The metal space has witnessed a decent correction in the last couple of months. The longer time frame charts of many of the metal stocks indicate that this is just a corrective phase within an uptrend and certain stocks could see good buying interest along with the market momentum.
Within this sector, Hindalco witnessed a good buying interest on December 31 and the stock has given a breakout from its immediate resistance. The volumes were good, indicating follow-up buying interest. The RSI oscillator is indicating a positive momentum.
Hence, traders can look to trade with a positive bias and buy in the range of Rs 475-470 for potential targets of Rs 500-510 in the short term. One can place a stop-loss below Rs 455 on long positions.
Expert: Shrikant Chouhan, Head of Equity Research (Retail), Kotak Securities
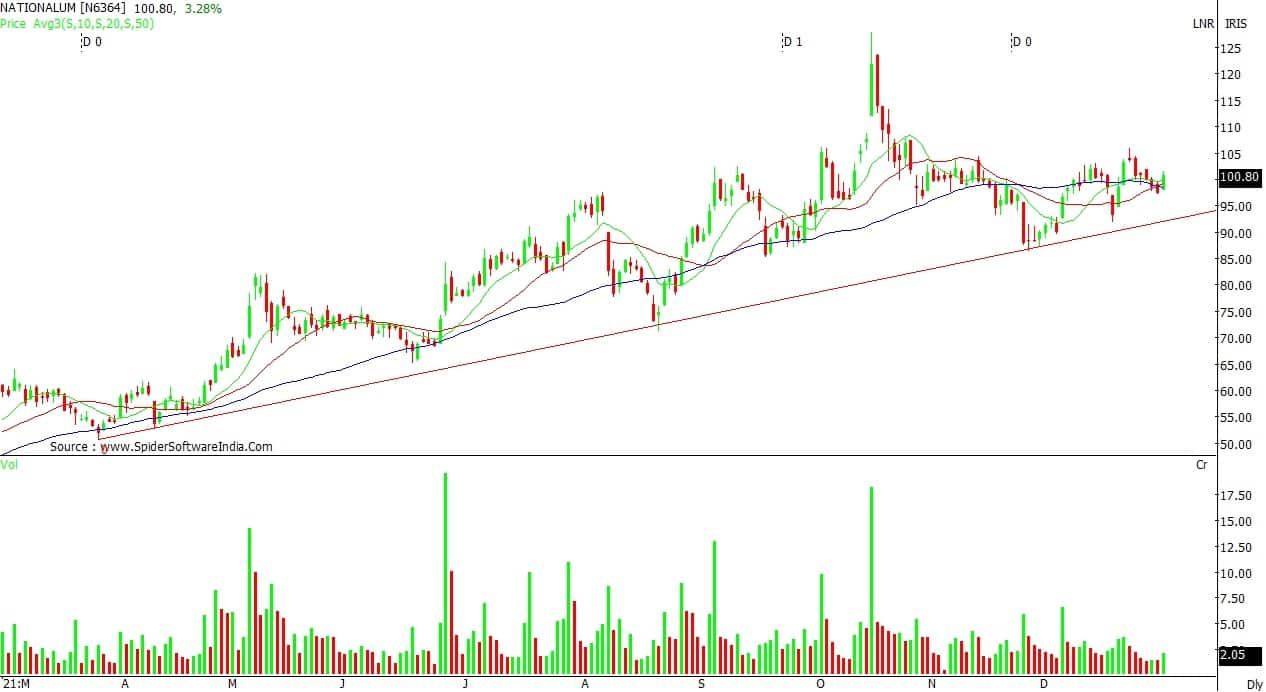
NALCO: Buy | LTP: Rs 101 | Stop-Loss: Rs 95 | Target: Rs 115 | Return: 14 percent
The stock is above the 50-day simple moving average (SMA) support and above the equilibrium level of Rs 100. The performance of the stock is good compared to the weakness in the index. The stock trend is positive and has been building a series of higher top higher bottoms since November 2021.
Depending on the short and medium-term charts, traders and investors should buy stocks at current levels. Keep the final stoploss at Rs 95. On the upside, the chances of going to Rs 108 and Rs 115 are bright.
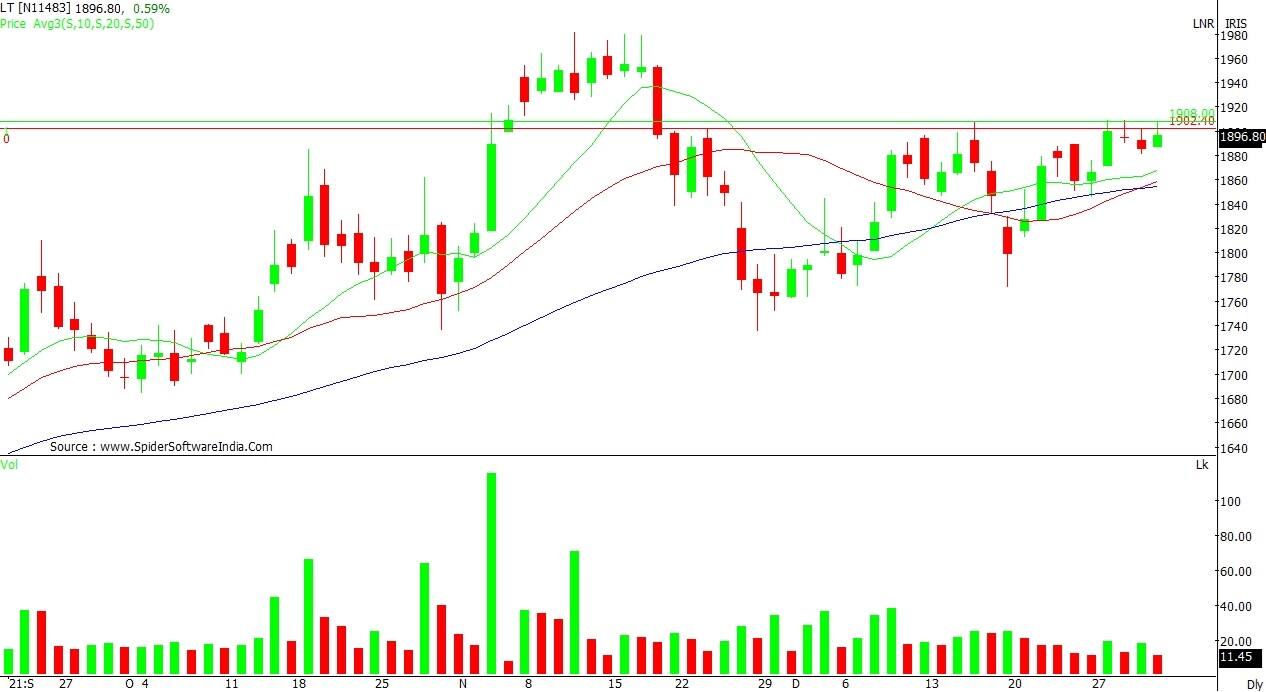
Larsen & Toubro: Buy | LTP: Rs 1,895.9 | Stop-Loss: Rs 1,800 | Target: Rs 2,050 | Return: 8 percent
It is consolidating above the 50-day SMA. On a monthly basis, it was one of the best-performing stocks, however, due to trading at a crucial retracement level, we saw sideways consolidation.
We should be buyers in the stock at Rs 1,890 and Rs 1,850. However, we need to protect the long positions with a stiff stop loss at Rs 1,800. On the upside, Rs 1,980 and Rs 2,050 would be the biggest hurdles.
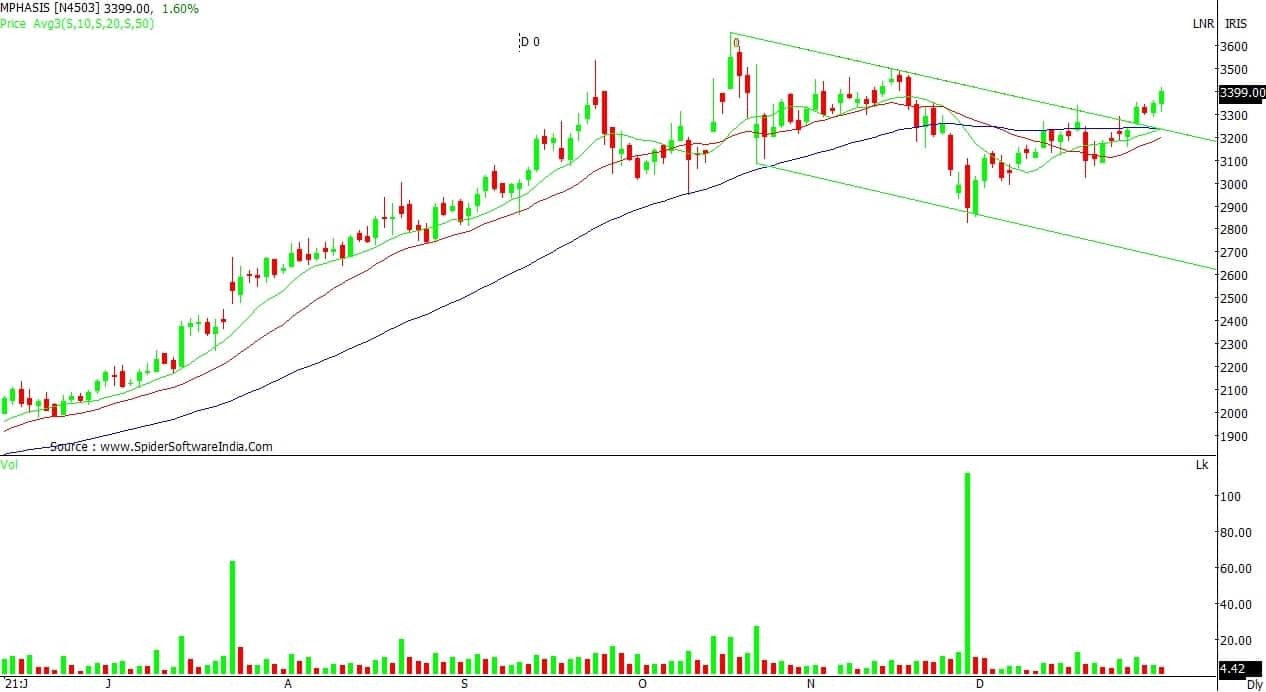
Mphasis: Buy | LTP: Rs 3,396.70 | Stop-Loss: Rs 3,200 | Target: Rs 3,660 | Return: 7.75 percent
The stock was in a corrective pattern from Rs 3,660 levels. The range of corrective patterns was between Rs 3,600 and Rs 2,850, which is quite a large. Such type of price correction usually results in the continuation pattern.
Based on the daily chart, it is breaking out of a flag formation and the price is sustaining above the supports of 20 and 50-day averages.
Our strategy should be to buy partially at the current level and keep the balance at Rs 3,250 and for that keep a stop-loss at Rs 3,200. On the upside, the Rs 3,500 and Rs 3,660 would be major resistance.
Expert: Vijay Dhanotiya, Lead of Technical Research at CapitalVia Global Research
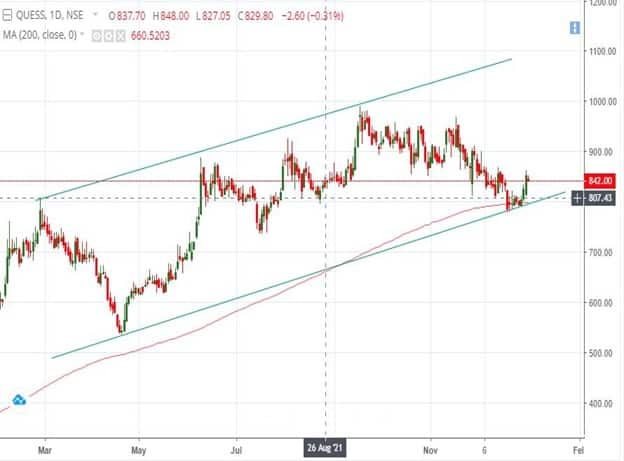
Quess Corp: Buy | LTP: Rs 856.35 | Stop-Loss: Rs 775 | Target: Rs 1,050 | Return: 22.6 percent
The stock is trading near the lower band of an ascending channel. We expect a reversal from the support of the lower band of the channel. It has also taken a support of EMA 200 line.
We have observed indicators like moving average convergence divergence (MACD) and RSI pointing that the momentum in the stock is likely to continue. We recommend a buy above Rs 865 with a target of Rs 1,050 with a stop-loss of Rs 775.
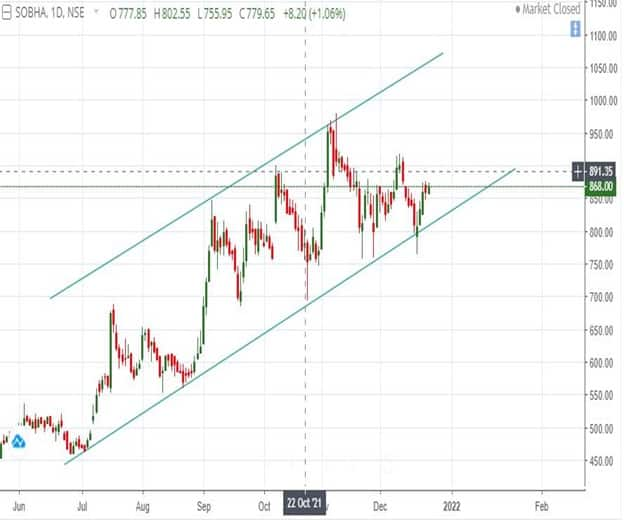
Sobha: Buy | LTP: Rs 895.45 | Stop-Loss: Rs 750 | Target: Rs 1,050 | Return: 17.2 percent
The stock has reversed from the support level near Rs 800. It has taken the support of the lower band of an ascending channel.
We recommend a buy above Rs 875 with a target of Rs 1,050 with a stop loss of Rs 750.
Apollo Hospitals Enterprises: Buy | LTP: Rs 5,013.40 | Stop-Loss: Rs 4,350 | Target: Rs 6,200 | Return: 24 percent
The stock has reversed from the support of the lower band of an ascending channel. It has also taken the support of 100 EMA.MACD and RSI indicate that the momentum in the stock is likely to continue. We recommend a buy above Rs 5,050 with a target of Rs 6,200 with a stop loss of Rs 4,350.

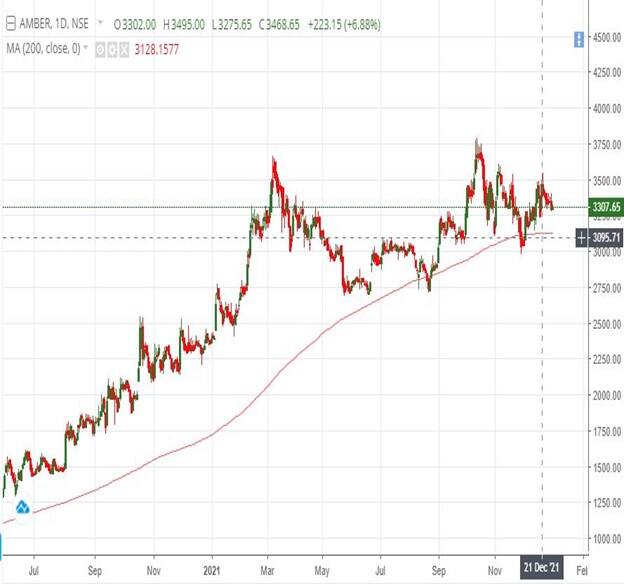
Amber Enterprises: Buy | LTP: Rs 3,316.20 | Stop-Loss: Rs 2,950 | Target: Rs 3,950 | Return: 19 percent
The stock has been trading in a positive manner and reversed from the previous level of Rs 3,250.
It has also taken support of 200 EMA and reversed from the same support level. We recommend a buy above Rs 3,400 with a target of Rs 3,950 with a stop loss of Rs 2,950.
Disclaimer: The views and investment tips expressed by experts on Moneycontrol.com are their own and not those of the website or its management. Moneycontrol.com advises users to check with certified experts before taking any investment decisions.