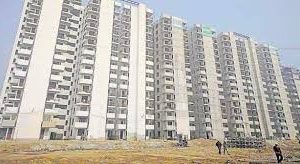
Pune Real Estate: The current inventory available for sale stands at a reasonable level of 23.36% of total homes under development.
The latest Gera Pune Residential Realty Report for the period January 2023 to June 2023 suggests that, after witnessing furious growth in the past in terms of sales and new launches – markets have streamlined at sustainable levels. Prices have increased by 11% across all projects over the last 12 months. New launches and sales have reduced however the replacement ratio remains healthy at 0.98 indicating that the sales are marginally more than new inventory added.
Read More: Housing Sales In India Hit 1.56 Lakh Units During January-June 2023, Prices Rise Up To 10%: Report
The report added that the total inventory under development across the Pune region has reduced by 5% from 315,088 to 297,801 homes. This constitutes 23.36% of the total inventory available for sale.
The company said that the report is based on primary and proprietary research conducted by it and covers all existing projects in a 30 kms radius of the city centre. The report is an outcome of the census-based study of the residential realty market of Pune covering 151 micro markets.
Read More: Planning To Buy House In Delhi-NCR? This Is Unsold Inventory Trend, Check Details
Summary of the key highlights of report;
- In the past few years, the supply squeeze that was prevalent in the Pune residential real estate space had led to developers launching new units to meet demand.
- However, this time around new supply has reduced by 16% to 46,007 units in the 6 months ended June ’23 compared to the 54,845 units that were launched during the 6 months ended June ’22 indicating that new launches while still at a healthy level, are being normalised to the steady state seen in the past.
- If one looks at the annual numbers, new launches have reduced by ~19% i.e., 93,734 homes were launched in the last 12 months compared to the previous 12-month period where it saw 115,996 units.
- The steepest drop of 23% is in the Premium segment (prices between Rs 5,833 per sq. ft. and Rs 6,998 per sq. ft.) This is followed by the Premium Plus segment (prices between Rs 6,999 per sq. ft. and Rs 8,748 per sq. ft.).
- The lowest drop of 8% in new launches is in the Luxury segment (prices above Rs 8,748 per sq. ft.). This drop to 93,734 units, though lower than the last year, is higher than earlier years. 2021 – 2022 saw increased launches coming out of 2020 – 2021 which was impacted by the pandemic.
- If one were to examine fresh supply zone wise, the Premium city centre (Zone 5) has seen a reduction in fresh supply by 13% to 4,422 units while PCMC (Zone 6) has seen a reduction of 10%. Overall – there has been a reduction in fresh supply across the board.
- However, operational metrics like the replacement ratio which is at 0.98 and inventory overhang don’t point to any red flags in the near term.
- The total inventory available for sale has reduced by 7% to 69,553 units as on June ’23 compared to June ’22. This number is a lot lower than the peak unsold level of 107,402 units seen in June ’16 at which time, the unsold inventory stood at 33% of the total homes under development.
- The current inventory available for sale stands at a reasonable level of 23.36% of total homes under development.
- The total inventory available for sale has dropped by 0.6% at a 6-monthly level and now stands at 7.66 Cr sq. ft. while the value of that inventory has increased to Rs 48,393 Cr.
- The sales volume has decreased by 8% over the last 12 months and 12% on a six-monthly level.
- Sales for the last 12 months has reduced to 97,214 units (July ’22 – June ’23) from 105,625 units between July ’21 – June ’22. The main contributor to the reduction is the sales in the sub 1,000 sq. ft. segment.
- However, the report said that pockets of growth are seen in the 1,001 sq. ft. – 1,800 sq. ft. segment. This time around the Budget and Value segments which were under stress in the recent past have seen a growth of 2% and 5% respectively compared to the Premium, Premium Plus and Luxury segments which have seen a reduction of 37%, 14% and 13% respectively.
- In particular, offtake in the Luxury segment which was growing by leaps and bounds has been arrested in this cycle.
- The market continues to trend towards larger projects (those with more than 500 units). The number of large projects in June ’18 was 115 projects, it has grown to 174 in June ‘23. The % share of such large projects to the total projects being developed has also increased from 3.3% in June ’18 to 7.8% in June ‘23.
- Looking at the total inventory distributed across small projects (less than 100 units)- only 11% of the total inventory is in this segment. This used to be 30% six years ago.
- In contrast, large projects (more than 500 units) now constitute 13% of the total inventory in Pune.
- Affordability levels continue to be very strong at 3.84x annual income. After trending down consistently post the 2015 peak in prices, home loan interest rates have recently started rising (since June ’22).
- The combined increase in interest rates from 7.7% in Dec ’21 to 9.85% in June ’23 and prices from Rs 4,926 per sq. ft. to Rs 5,782 per sq. ft have impacted affordability which has shown a dip over the 3.61x levels in June ‘22. Over this time however, incomes have risen thereby increasing affordability significantly.
- However, as mentioned earlier, this cycle may have bottomed out with home prices as well as interest rates rising significantly. Input costs for developers have forced developers to raise prices.
- Increasing interest rates and inflation get the home buyer less per Rupee and hence, the affordability equation, though still healthy, can still create headwinds for developers.
- The other impact of affordability is that customers now can move to bigger developers who have the capabilities to deliver on promises. When affordability was low, customers had no choice but to settle for lesser-known developers, leading to a fragmented market.
- Now, customers can afford to pay for homes by the reputed branded developers and in many cases, customers are paying a premium for reputation and track record.
- The inventory overhang (based on the offtake rate for 12 months) increased slightly to 8.59 months.
- Despite the overall increase, inventory overhang in the Premium and Luxury segment continues to improve. It has halved in the Luxury segment ~20 months 6 years ago to ~9 months now.
- While it has increased significantly to 10.62 months as on June ’23 from 8.26 months in June ’22in the Value segment has.
- Broadly though, at only 8.59 months of inventory left the inventory overhang remains quite robust across all segments compared to what it was 6 years ago pointing to an optimistic and promising market situation.
Pune Real Estate: Investment Outlook
Rohit Gera, MD, Gera Developments, said “The Pune real estate market is showing dual signs of both boom and consolidation at the same time. The prices have gone up 11.03% from Rs 5,208 per sq. ft. in June ’22 to Rs 5,782 per sq. ft. in June ’23. There has been an across-the-board increase in the rates of new projects, existing phases of old projects as well as new phases of old projects. This indicates a strong demand as home buyers have purchased homes at higher prices than ever before.”
“On the other hand, the overall sales for the past 12 months have come down by 8% from 105,625 units in the period June ’21 – June ’22 to 97,214 units in the period June ’22 – June ’23. This could be explained by the increase in home prices and increase in interest rates. The increase in prices and a corresponding reduction in demand are normal indicators of a bull market,” Gera added.
“On the other hand, during a boom period, there is an increase in the number of projects launched. We are presently at a 10 year low in terms of the number of projects and gross inventory. Over the past year (June ’22 – June ’23) 93,734 new homes were added to the overall inventory. This is down nearly 19.19% from the previous year’s new inventory of 115,996 homes.”
He further added, “The trend that has continued though is that of the increase of average size of projects, reduction in the number of projects of smaller sizes, greater dominance of projects from larger developers. Looking forward, there are a couple of scenarios that could play out. If developers bring in substantial supply, we could be in an oversupply scenario since sales numbers have eased off from earlier highs. On the other hand, constrained supply at the current equilibrium levels could see a continued steady rise in prices.”