
Ghost shopping centres, also known as dead malls or abandoned malls, are shopping centres that have fallen into disuse.
There has been an increase of 59% year-on-year (YoY) in Ghost Shopping Centre by Gross Leasable Area (GLA) since 2022 in the prime markets while the number of shopping centres that moved to 64 shopping centres by the end of 2023 over 57 in 2022, says a new report.
As a result of the rise in Ghost Shopping Centres (shopping centres with vacancy of 40% or more), Knight Frank India estimates that loss of value to be at INR 67 billion (Bn) or USD 798 million in 2023.
Read More: Petrol, Diesel Fresh Prices Announced: Check Rates In Your City On May 8
Ghost shopping centres
Ghost shopping centres, also known as dead malls or abandoned malls, are shopping centres that have fallen into disuse. Usually, they’re characterised by two main features:
- High vacancy rates: A large portion of the storefronts in the mall are empty, with vacancy rates often exceeding 40%.
- Low foot traffic: Very few customers visit the mall, creating an eerie and deserted atmosphere.
The rise of online shopping is a major factor contributing to the growth of ghost shopping centres. Consumers are increasingly comfortable purchasing goods online, bypassing physical stores altogether.
Knight Frank India’s latest report, ‘Think India Think Retail 2024 – Shopping Centre and High Street Dynamics Across 29 Cities’, records a sharp rise in low performing retail assets with approximately 13.3 million square feet (mn sq ft) of retail shopping centre space categorised as ‘Ghost Shopping Centre’.
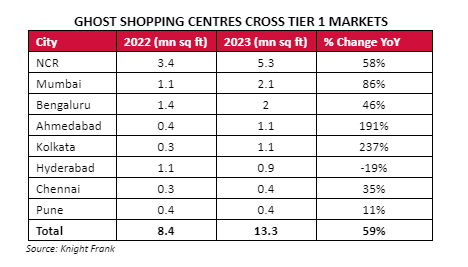
National Capital Region (NCR) accounted for the highest Ghost Shopping Centre stock measuring at 5.3 mn sq ft (rise of 58% YoY), followed by Mumbai with 2.1 mn sq ft (rise of 86% YoY) and Bengaluru with 2.0 mn sq ft (rise of 46% YoY).
Read More: Air India Express to allow passengers to reschedule flights amid cabin crew ‘shortage’
Hyderabad is the only city to record a decline in the Ghost Shopping Centre stock by 19% YoY to 0.9 mn sq ft in 2023. The sharpest rise in Ghost Shopping Centres was recorded in Kolkata (23=7% YoY), albeit at a lower base
In tier 1 cities the total number of shopping centres have reduced in a period of one year.
Despite the addition of 8 new retail centres, the total number of shopping centres reduced to 263 in 2023 as 16 shopping centres were shut down over the last year. Underperforming shopping centres were either demolished due to reasons such as developers undertaking residential or commercial developments or were permanently closed or auctioned.
Think India Think Retail 2024 – Shopping Centre and High Street Dynamics Across 29 Cities, delve into the retail real estate markets beyond the top-tier markets. This comprehensive study covers 340 shopping centres and 58 high streets across 29 Indian cities, conducted through primary surveys. This unique survey meticulously examines retail locations in the selected markets to compile a comprehensive compendium of store-level information.
Tier 1 cities witness 64 Ghost Shopping Centres in 2023
Shopping centres in distress grapple with ongoing hurdles, compounded by fresh additions worsening their already elevated vacancy rates. This surge has led to a rise in the count of shopping centres labelled as Ghost Shopping Centre stock. Such a scenario offers institutional investors the chance to explore avenues for repurposing or revitalising their retail portfolios, while developers can seize opportunities to monetize these assets through repurposing or redevelopment efforts.
Read More: Gold Rate Rises In India: Check 22 Carat Price In Your City On May 08
Gross Leasable Area
According to Knight Frank Research, as of 2023, India has a total shopping centre stock of 125.1 mn sq ft. The top 8 Indian cities constitute 75% of the total GLA, measuring 94.3 mn sq ft across 263 shopping centres while Tier 2 cities constitute 30.8 mn sq ft. Of the top 8 cities, NCR (31.3 mn sq ft), Mumbai (16.3 mn sq ft) and Bengaluru (15.6 mn sq ft) were the top three cities in the pecking order of GLA available in the shopping centres.
Amongst the tier II cities, Lucknow (5.7 mn sq ft), Kochi (2.3 mn sq ft) and Jaipur (2.1 mn sq ft) were the leading three cities in terms of GLA available in shopping centres. Lucknow has emerged as a key player with an impressive share of 18% gross leasable area within Tier 2 Cities.
Overall shopping centre vacancy, across leading eight cities in India, has improved from 16.6% in 2022 to 15.7% in 2023, noting an 87-basis point reduction. The overall shopping centre vacancy includes Ghost Shopping Centres. However, upon exclusion of Ghost Shopping Centres from the stock in the leading 8 cities, the shopping centre health in India improves dramatically from 7.4% in 2023 due to the excellent performance of Grade A assets and reasonable occupancy in Grade B assets.
Shishir Baijal, chairman & MD, Knight Frank India, said, “The momentum of consumption, propelled by rising disposable incomes, a youthful demographic, and urbanisation, tilts in favour of the organised retail sector. An enhanced retail experience remains crucial for shoppers, highlighting the significance of physical retail spaces.
Grade A malls have notably excelled, maintaining robust occupancy, foot traffic, and conversion rates, thereby delivering value to their customers. Conversely, Grade C assets and those classified as Ghost Shopping Centres are lagging, prompting landlords to take action to rejuvenate or divest such properties.”
Grade A Assets Take Precedence
Retailer appetite for expansion has led to increase in preference for Grade A assets at an all-time high. Leading to the high double-digit vacancy in Grade C structures as performance and operational metrics of better-performing malls improved. Ahmedabad and Kolkata have witnessed a sharp rise in vacancy compared to the last review period, as there is scope for infusion of institutional-owned shopping centre stock and development of premium properties in these cities.
Of the 340 operational shopping centres across 29 cities, Grade A stock with GLA of 58.2 mn sq ft comprise 82 assets. Grade A shopping centre stock, with enviable occupancy, strong tenant mix, good positioning, and active mall management, contributed 47% to the overall shopping centre space across the country.
Grade B shopping centre stock, with decent occupancy and tenant mix, contributed 31% with 39.7 mn sq ft. Grade C stock, on the other hand, with high vacancy rates, inferior tenant mix, poor mall management, contributed the lowest with 22% as 27.2 mn sq ft leasable space is locked in these assets.
Revenue Potential
In the report, Knight Frank has projected potential revenue of the shopping centres across 29 cities to reach USD 14 billion (bn) during FY 2024-25. The revenue projections for shopping centres is based on an extensive primary survey of 340 shopping centres, including the top 8 cities.
Shopping Centre Density: Contrasting Retail Landscapes In Tier 1 And Tier 2 Cities
Among Tier 1 cities, Bengaluru stands out with a notable shopping Centre density of 1,147 sq ft / 1000 people, reflecting its robust retail infrastructure and commercial vibrancy. Following closely, Pune and NCR also demonstrate substantial shopping Centre density values of 1,142 sq ft / 1000 people and 949 sq ft/ 1000 people respectively, indicative of well-developed retail landscapes catering to their sizable urban population. Conversely, Kolkata appears at the bottom among Tier 1 cities, with a shopping Centre density of 33 sq m (357 sq ft), suggesting a relatively lower concentration of shopping centre stock compared to its counterparts. The national average for India is estimated at 710 sq ft / 1000 people.
Moving to Tier 2 cities, Mangaluru emerges as the leader in shopping centre density, amongst all city types, with a striking density of 1,884 sq ft / 1000 people indicating a high penetration of organised retail spaces, i.e., – Shopping Centres relative to its population size.
Followed by Lucknow with a significant shopping centre density value of 1,439 sq ft / 1000 people, underscoring its robust commercial infrastructure catering to urban demands. Outstandingly, Chandigarh and Bhubaneswar also showcase a notable shopping Centre density figure of 1,325 sq ft and 1,250 sq ft per 1000 people which is more than all the Tier 1 cities, reflecting a thriving retail landscape.
Apparel leads the chart in shopping centres occupying 33% share in terms of store presence followed by Food and Beverages occupying 16% of the area which exhibits the importance of dining options for consumers as an integral part of their shopping trips. Entertainment, Home and Lifestyle and Department store categories occupied 3% share each in terms of number of store presence. This leaderboard remains broadly the same from the previous year.